13. Inspecting and Debugging in GemStone
The GemStone Smalltalk Debugging Tools allow you to inspect objects in both the GemStone and client object spaces, and to set breakpoints in and debug GemStone Smalltalk code, similarly to how you debug client Smalltalk code. GemBuilder’s Debugger and Inspectors are integrated with the client Smalltalk debugger to allow seamless debugging of code in both object spaces.
This chapter describe the differences and additions that GemBuilder makes to the client Smalltalk debugging tools.
13.1 Inspectors
To allow you to examine the values of GemStone server objects and modify them when appropriate, GemBuilder provides enhancements to the client Smalltalk inspectors. When you select a GemStone Smalltalk expression and execute GS-Inspect it, an enhanced client Smalltalk inspector opens on the GemStone server object.
For example, if you select and GS-Inspect it on:
Array with: 'aaa' with: 'bbb' with: 23
The resulting inspector displays as shown in Figure 13.1.
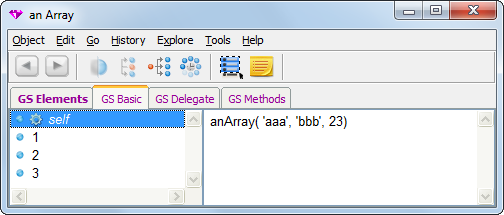
When inspecting a GemStone server object, the inspector provides additional tabs with the GS prefix, indicating that these apply to a GemStone server object.
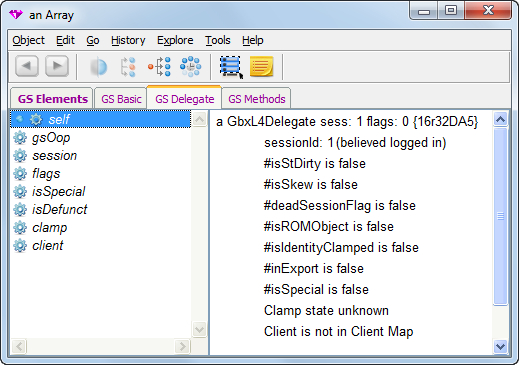
In addition, there is a tab labeled “GS Delegate”, which allows you to examine the internal state of the object’s delegate in GemBuilder.
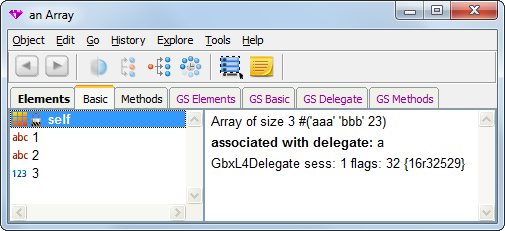
When inspecting a client object that has a corresponding GemStone server object (or vice versa), the inspector allows you to view both the client object and the server object in the same inspector. Client objects with corresponding server objects includes replicates of server objects, forwarders to server objects, stubs, and objects that are always mapped such as nil, true, false, SmallIntegers, and Characters. When you are inspecting one of these objects, you will see two sets of tabs: one that allows you to examine the client object, and a second similar set of tabs with the GS prefix, to examine the associated GemStone server object.
For example, if you select the following text and Inspect it:
GBSM evaluate: 'Array with: ''aaa'' with: ''bbb'' with: 23'
The following inspector displays both the client and server object:
Figure 13.3 Inspector for Objects that exist on both client and server
Executing code in the inspector
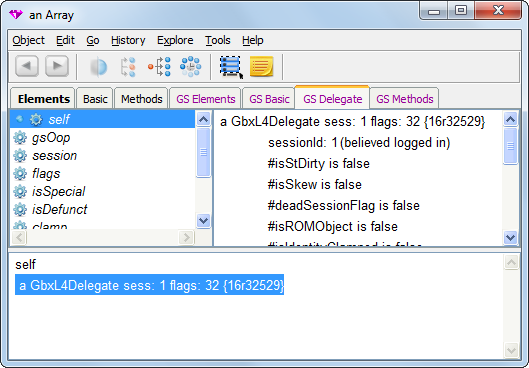
In the evaluation pane of the inspector, or any other pane, the use of “self” is resolved according to the following rules:
- Do it, Print it, Inspect it and Debug it resolve self to the client object.
- GS-Do it, GS-Print it, GS-Inspect it, and GS-Debug it resolve self to the GemStone server object.
- When the GS Delegate tab is selected, Do it, Print it, Inspect it and Debug it resolve self to the delegate object, as shown in Figure 13.4.
13.2 Debugger
The GemStone Debugger is integrated with the client Smalltalk debugger, allowing you to step through client Smalltalk code and GemStone server code in the same tool. Using the GemStone debugger, you can:
- view GemStone Smalltalk and client Smalltalk contexts together in one stack
- select a GemStone Smalltalk or client Smalltalk context from among those active on the virtual machine stack
- examine and modify objects and code within that context
- continue execution either normally or in single steps
Figure 13.5 Debugger
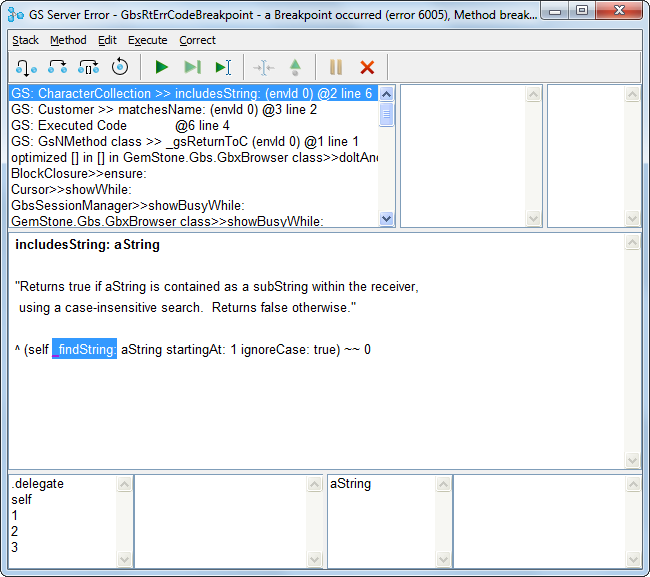
When GemStone Smalltalk execution is interrupted, it either directly opens the Debugger, or a notifier that includes a Debug button. Selecting the Debug button opens the Debugger. A runtime error opens a notifier, while a breakpoint, user interrupt, or an Object >> pause opens a debugger. You may also use the menu item GS Debug-it to open a Debugger on a code snippet, which opens a debugger on that code.
The Debugger’s stack pane displays the active call stack and allows you to choose a context (stack frame) from that stack for manipulation in the window’s other panes. Both GemStone server and client contacts are listed. GemStone server contexts begin with “GS”.
The Debugger is much like the client Smalltalk debugger, with the menus enhanced with GemStone options. Like other GemBuilder text areas, the debugger source code pane provides commands to execute GemStone Smalltalk.
Colored contexts
You may configure VisualWorks to color the GemStone server contexts, to distinguish them from client contexts. To do this, select the Settings button on the Launcher toolbar, or go to System > Settings, and select Debugger (under Tools). Select the button to edit the Context List Presentation. If no Patterns exist, create a new Pattern for Everything with the Pattern String *. Then, create a new Pattern with the Pattern String $L$GS*, and select a color for the GemStone server contexts text. This new Pattern must be above the Pattern String *.
The following example demonstrates doing the same action using a script.
Example 13.1 Colored Debugger Contexts using a script
| patterns contextPattern|
patterns := OrderedCollection new.
contextPattern := (ClientContextPatternSpec new)
color: (ColorValue red: 0.2 green: 0.0 blue: 0.5);
name: 'GemStone';
pattern: '*$L$GS*';
yourself.
patterns add: contextPattern.
contextPattern := (ClientContextPatternSpec new)
color: ColorValue black;
name: 'Everything';
pattern: '*';
yourself.
patterns add: contextPattern.
ContextListPolicyEditor.Patterns := patterns.
13.3 Breakpoints
Setting a breakpoint in your code allows your code to run up to that point, so you can start debugging there.
Step Points
For the purpose of determining exactly where a step will go during debugging, a GemStone Smalltalk method is composed of step points. You can set breakpoints at any step point.
Generally, step points correspond to the message selector and, within the method, message-sends, assignments, and returns of nonatomic objects. However, compiler optimizations may occasionally result in a different, nonintuitive step point, particularly in a loop.
More detail on step points within GemStone Smalltalk methods is provided in the Topaz Programming Environment, Chapter 2.
Example 13.2 indicates step points with numbered carets, as is output in the topaz environment.
Example 13.2 GemStone Server method step points
includesValue: value
^1
"Return true if the receiver contains an object of the same value
as the argument. Return false otherwise."
| found index size|
found := false.
^2
index := 0.
^3
size := self size.
^5 ^4
[ found not & (index < size)] whileTrue: [
^6 ^8 ^7 ^9
index := index + 1.
^11 ^10
found := value = (self at: index)
^14 ^13 ^12
].
^found
^15
If you use the GemStone debugger to step through this method, the first step takes you to step point 1, the point where includesValue: is about to be sent. Stepping again sends that message and halts the virtual machine at step point 2, the point where found is assigned. Another step sends that message and halts the virtual machine just before the result is assigned to index, and so on.
Breakpoints
You can set a breakpoint in any method by selecting the position in the source text and menu item Set Breakpoint. The step point nearest your cursor position is used for the breakpoint, and the first letter of the text following the breakpoint will be highlighted (colored and underscored).
You can remove the breakpoint by selecting the specific break and using the menu item Remove Breakpoint, or by using Remove All Breakpoints. Breakpoints can also be removed using the Breakpoint Browser, described in the next section. This tool also allows you to disable breakpoints, but leave them in your methods.
When the GemStone Smalltalk virtual machine encounters an enabled breakpoint during execution, GemStone opens the GemStone Debugger. In the Debugger you can interactively explore the context in which execution halted.
Breakpoint Browser
To see a complete list of the breakpoints you have set anywhere in your GemStone server code, use the Breakpoint Browser. You can open a Break point Browser using the Browse > Breakpoints menu item on the GemStone Launcher.
In addition to allowing you to examine, remove and add breakpoints, the Breakpoint Browser allows you to disable breakpoints without removing them, and later re-enable these breakpoints. These operations can be performed on a single selected breakpoint or on all breakpoints.
A breakpoint browser has two panes: the list of break points on top, and the source code associated with the selected breakpoint on the bottom.
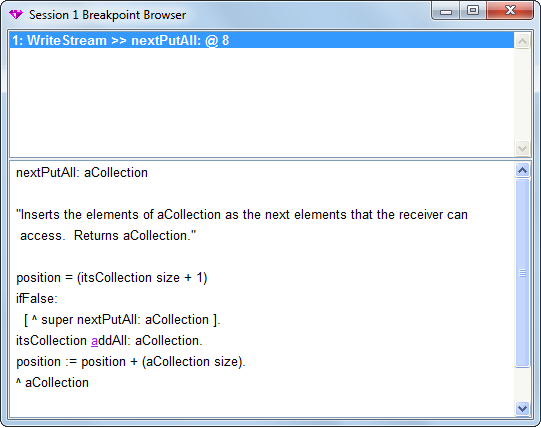
Breakpoint Pane
The breakpoint pane displays a scrollable list of the active breakpoints. The items in the list include the Class and method name, and the step point within the method. In this example above, a method break is set at step point 8 within the method nextPutAll: defined by class WriteStream.
The Breakpoint Pane has the following menu items: 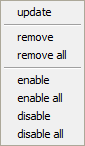
update Update the list of breakpoints with any recently added breakpoints
remove Remove this breakpoint.
removeAll Remove all breakpoints
enable Enable this breakpoint. Has no effect if the breakpoint was not previously disabled.
enableAll Enable all breakpoints. Has no effect if no breakpoints were previously disabled.
disable Disable this breakpoint, but do not remove it. A disabled breakpoint will not cause a break, and displays with (disabled) in the breakpoint browser
13.4 Stack Traces
In some situations it is easier to extract complete stack traces for later analysis, rather than debugging interactively. In addition, you may need a stack trace to provide to GemStone Technical Support. GemBuilder includes facilities to dump the complete stack, with more information than provided in the standard stack, including information on GemStone server contexts and “glue” contexts.
To extract a complete stack, execute
GbsStackDumper dumpAllProcessStacks
In response, all processes in the image write their complete contexts to a file named stacksAtx.txt in the current working directory, where x is a string containing a timestamp. For example, StacksAtFebruary-22-2013-11.00.20-AM.txt.
To dump the stacks to a particular file location:
GbsStackDumper dumpAllProcessStacksToFileNamed: aString
These methods do not require the debugger, and can be used in runtime applications.
13.5 Call Tracing
GemBuilder relies on the GemStone server for much functionality, which it accesses by making GCI calls. You can configure GemBuilder to log each of these calls, which allows debugging of some intractable problems.
Call tracing produces a record of the low-level calls made, and are intended for use by experts who are familiar with the internal operations of the GCI calls. Normally, you would only use Call Tracing when advised by GemTalk Technical Support to diagnose specific problems.
Call tracing may produce a very large amount of output. Call tracing can be done to a file, or to a ring buffer in memory.
The following methods are available to turn on and off call tracing:
GemStone.Gbs.GbsCallTracing >> startCallTracingToFile
Turns on call tracing and records the traces to file with a default name, gbstrace-timestamp.log, in the current working directory. If call tracing was already on, a new log file is started.
GemStone.Gbs.GbsCallTracing >> startCallTracingToFileNamed: aString
Turns on call tracing and records the traces to the specified file. If the file exists, further tracing will be appended to this file.
GemStone.Gbs.GbsCallTracing >> startCallTracingToMemoryMegabytes: aNumber
Turns on call tracing and records the traces in a ring buffer of the specified size. The contents of the ring buffer can be written to a default file on request.
GemStone.Gbs.GbsCallTracing >> startCallTracingToMemoryMegabytes: aNumber fileName: aString
Turns on call tracing and records the traces in a ring buffer of the specified size. The contents of the ring buffer can be written to the specified file on request.
GemStone.Gbs.GbsCallTracing >> stopCallTracing
Turns off call tracing, if currently on.
GemStone.Gbs.GbsCallTracing >> writeToFile
Writes the current log to its file, if not already done. This is only useful when using a memory logger. It is safe to send this message regardless of the state of call tracing.
GemStone.Gbs.GbsCallTracing >> logMessage: messageString
If call tracing is active, the message is recorded, either to the log file or the ring buffer.
GemStone.Gbs.GbsCallTracing >> isCallTracingActive
Answers whether call tracing has been started and remains active.
GemStone.Gbs.GbsCallTracing >> isFileCallTracingActive
Answers whether call tracing has been started to a file, and remains active.