2. VSD’s Graphical Interface
VSD provides a graphical way to view the data that is recorded by statmonitor. When you open VSD on this data, you will see a very large number of statistics that were recorded for potentially a very large number of GemStone processes. Not all of these are going to be useful; your task is to locate the interesting and useful information.
2.1 Starting VSD
You can start VSD from your windowing system or from the command line.
-
Double click on
vsd in a graphical file browser
or vsd.exe in Windows Explorer. -
Execute
vsd at the command line.
You can either provide the full path to the vsd executable, navigate to the directory containing vsd, or, if the directory containing the vsd executable is on your machine search path, just enter ‘vsd’.
You may start VSD and automatically open a specific data file by:
prompt> vsd statmonDataFileName
vsdinstalldir /bin/vsd statmonDataFileName
The main VSD window will appear; if this is your first time running VSD, an additional window will appear providing access to the version history and help.
2.2 Main VSD Window
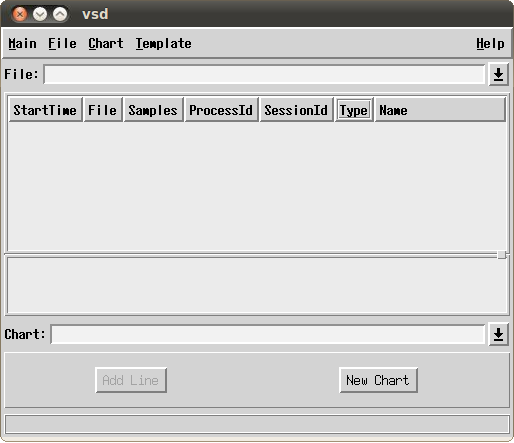
When VSD is started, it displays the Main window. This window has a single instance and remains open while you are running VSD.
The main window displays the list of processes and other information about the statmonitor file; here, you will locate and select processes and statistics for which you want to view charts.
This window also contains many configuration options that control how your charts are displayed. These options are stored, so next time you open VSD you will get the same options. For more details, see VSD Configuration Files.
Loading data for viewing
If you opened VSD with a particular data file or files as an argument, the main window will display the processes listed from that file. Otherwise, you need to load a data file, or start monitoring a running server.
Loading an existing statmonitor file
To load a statmonitor file into VSD, use the menu item Main > Load Data File...
This brings up a file dialog that allows you to browse for an existing statmonitor output file.
If you know the name of the file you would like to load, you can also type the full path in the File entry box.
Updating the view if the data file is updated
You may load a statmonitor data file that is still being updated by the live system. As new data is added to this file, you have the option to have vsd update its view.
If you select File > Auto Update , VSD automatically updates your display, and any associated charts, any time the data file changes. Otherwise, if auto update is disabled, you can choose File > Update periodically to update the displays when you choose.
Loading multiple data files
You can load multiple statmonitor files using the menu item Main > Load Data File... ., or by specifying multiple files on the command line. Each file is loaded, though you can view the list of processes for only one file at a time. To switch between them, click the down-arrow next to the File entry box, then select a file from the list.
If your multiple data files are logically a single data set; (for example, you start statmonitor on the same repository, shut it down, and start it again), then you can append the second data file rather than load it. This is done using the File > Append Data File menu item, or by using the -a command line argument.
Monitoring statistics on a running GemStone server
You can use VSD to start statmonitor and automatically read directly from the data file statmon is currently creating. This options is not available on Windows.
Step 1. Bring up the Monitor window using the menu item Main > Monitor
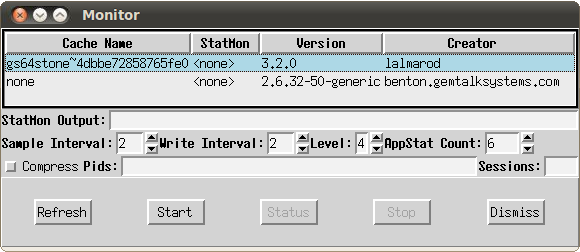
The Monitor window will display a list of anything that statmonitor can monitor on this host; all shared caches on this machine, and the system itself.
Step 2. Select the cache you wish to monitor, and the monitoring options.
These options are a subset of those offered by the server statmonitor utility. Options are:
By default, this is empty, and statmonitor will create a file with the default name in the current directory. You must have write permission for the directory in which this file is located. For example, if you started vsd while in the $GEMSTONE/bin directory, you must specify a path and filename for another directory, in which you do have write permission.
- The sample interval (in seconds)—that is, how frequently to read the cache.
- The write interval—the maximum number of seconds to wait before flushing the samples to the output file. This determines the rate your monitoring view is updated.
- The statistics level—the amount of non-GemStone, OS-level information to collect. Larger numbers result in more and differing sets of statistics being sampled. Available levels vary by platform.
- The number of application statistics (shared counters) to gather.
- Whether to compress the output file.
- You can select to monitor only processes with specific Process Ids or Session Ids. Normally, all processes are monitored.
Step 3. Click the Start button to start monitoring.
This will start statmonitor, and create a statmonitor data file in the current working directory. If statmonitor startup fails, the Monitor status window will appear which shows the statmonitor command line.
The Monitor windows will remain open. You can use the Dismiss button to close the window; this does not affect monitoring.
VSD loads the data file as soon as it has some samples in it (unless you have explicitly turned off Auto Update).
The statmonitor data file that is created by monitoring will grow as long as you are monitoring. If you have a large system and collect samples frequently, this file may become very large.
Step 4. Click the Stop button to stop monitoring.
If you have dismissed the Monitor window, you can re-open it using the menu item Main > Monitor . Select the cache you have been monitoring to enable the Stop button.
Note that the statistics data that is created will remain, and can be viewed later. It must be explicitly deleted if you no longer need it.
After you’ve loaded the data file or started monitoring, the VSD window looks something like this:
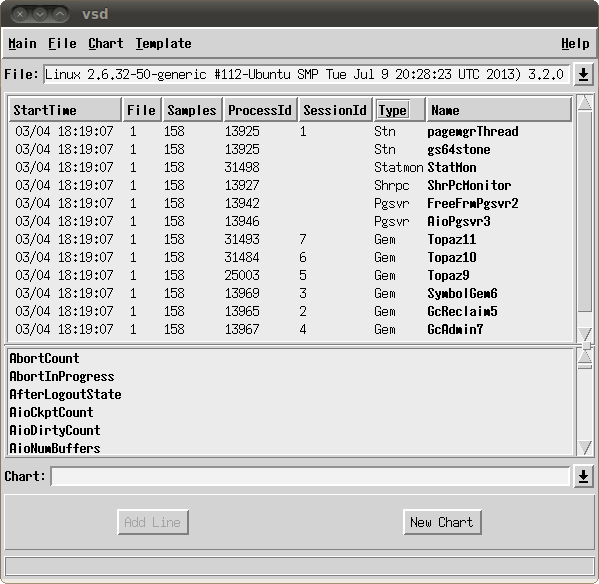
Process List
The upper list pane contains a list of all the entities—processes, thread-based sessions within processes, and other entities such as the disks—for which data is recorded in the statmonitor data. Depending on the options used to collect the data, this may include all GemStone processes or a small subset, and may include a number of non-GemStone entities including the operating system, disks, etc. While these are not all strictly “processes”, in the following discussion this term is used to include all entities that appear in the process list.
For each process, session, or other entity, the display includes:
- The StartTime - the time that process first recorded a sample, adjusted to local time on the machine executing VSD.
- The File id for the file in which it was recorded. This is of interest if you have more than one file loaded; the file id corresponds to the number in the file select drop-down.
- The total number of Samples for that process recorded in the data file.
If you are monitoring, processes that are currently running and for which samples are being taken are shown in green, and these number will change as new data samples are taken.
- the OS ProcessID for the process. Multi-threaded processes in which the threads are GemStone sessions will have individual entries for each thread, and list the same process Id for each.
- the GemStone SessionId for that processes. This only applies for GemStone sessions.
- the process Type .
GemStone processes fall into a number of types, which govern which statistics apply. The common process types are:
Shrpc — shared page cache monitor
Pgsvr — AIO or free frame page server, or a page server for a remote session
Gem — Gem; includes system Gems, RPC Gems, and linked sessions such as linked Topaz
Additional types will appear if you are also monitoring OS information, including platform-specific statistics.
This is assigned by statmonitor or GBS’s Stat Monitor, and displayed in VSD. It may be assigned for Gem processes within the GemStone server; see Process names in GemStone.
Sorting
By selecting a column header in the main windows, you can sort all the processes by that column’s attribute.
For example, if you want to find the Stone, you can sort by Type. Or, if you know the session ID of the Gem, you can sort by SessionId and scroll down under you find that Gem.
Selecting Process
When you select a process, the list of statistics relevant for that process is displayed in the statistics pane. Multiple selection is allowed.
Selecting Sets of Processes
The pop-up menu option Select allows you to select all processes matching a particular criteria. The options are:
By type —select all processes of the same type as the currently selected process. Does nothing if no process is selected.
By statistic —select all processes for which the currently selected statistics applies. Does nothing if no statistic is selected.
Statistics List
The lower pane displays a list of statistics.
Each process type has a specific set of statistics that are relevant for that process. Many of these are unique for that process type; for example, CommitCount applies to Gem processes, while TotalCommits is meaningful for the Stone. Others, such as UserTime, apply to all processes.
When no process is selected, all statistics in the system are shown. When a particular process is selected, only statistics appropriate for that process type are listed. When multiple processes are selected, only statistics that are common to all the selected process types will be listed.
You may scroll down the list to locate the statistic you want. Typing in the first character will select the first statistic with a name beginning with that letter.
Notice that some statistics are listed in bold font, while others are in regular font. Statistics with the font in bold have non-zero values recorded.
Controlling visibility of statistics
Hiding statistics with only values of zero
You may hide statistics for which the value of that statistic is 0 for the entire sample set. These are the statistics that are listed in non-bold font.
To hide statistics where there are no non-zero values, check No Flatlines in the Main menu or in the right mouse button popup menu.
Statistics Level
Each statistic has a characteristic called a level reflecting the amount of background knowledge about GemStone processes needed to use it with understanding. You can set up VSD to list only those statistics that are at, or below, a certain level of complexity.
To establish the levels of statistics that you want to display in VSD, choose Statistic Level from the VSD window’s Main menu:
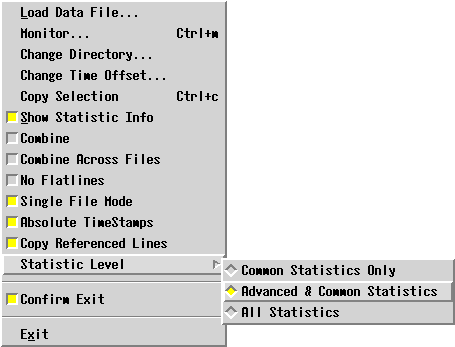
The level of statistics you select will be recorded in your .vsdrc file, and will be used automatically the next time you start VSD. See VSD Configuration Files for details on VSD configuration files.
Meaning of statistics
While many statistics have intuitive names, you will often need to look up details. Cache Statistics Reference, has a complete list of statistics.
You should not expect to understand every statistic recorded for your system. Some of these statistics require an intimate knowledge of GemStone server internals, some are experimental, some may only apply under specific server conditions. GemStone documentation, Techtips, and analysis from GemStone Technical Support will include specific statistics that are particularly helpful.
The information in the current version of VSD, including more detail, is displayed in the Statistics Information Window. To open the Statistic Information, use the menu item Main > Show Statistics Info .
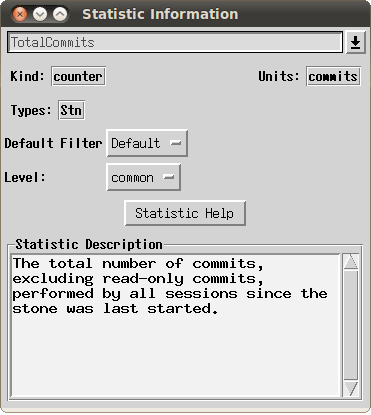
This singleton window can be left open; it will display the details for any selected statistics as it is selected. You can also lookup statistics using the drop down.
Selecting and viewing statistics
After you have selected one or more processes and one or more statistics, you can display these results in a chart by clicking on the New Chart button. You can create a named chart by entering a name in the Chart name entry field.
If you have a chart open, you can add the selected statistics to an existing chart. Select the chart by name in the drop-down with the Chart name entry field, then click on the Add Line button. The Chart name is set to the most recently selected chart, so if you do not explicitly select a chart, the statistics will be displayed in the most recently selected chart.
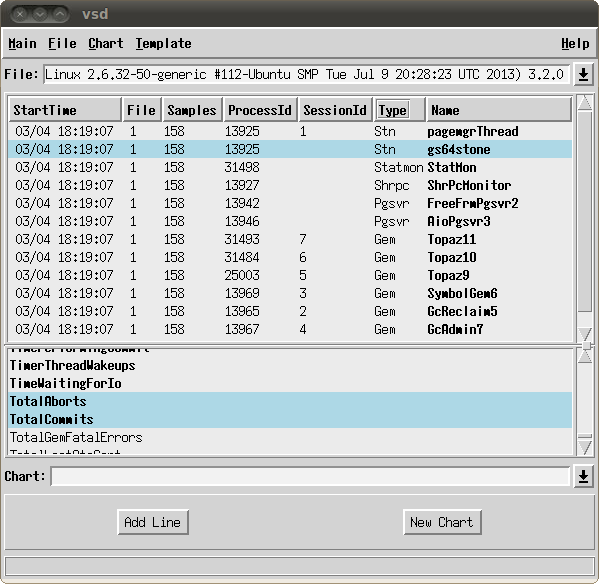
The following shows the main window with one process selected, the Stone, and two statistics selected, TotalAborts and TotalCommits.
2.3 VSD Statistics Chart
VSD statistics charts allow you to view and analyze the data for the statistics you have selected. You may have many charts open.
Chart Window
When you first open a chart, all the values for all statistics are displayed with its default settings. Each line has a unique color and/or pattern.

At the bottom is the Legend - the list of process statistics that are viewed in this chart. Each is described by Process name and statistics name.
The axis of the graph are labeled; the bottom axis is always time.
The Y-axis is labeled with the number of the units for all the statistics; this may or may not be meaningful, if the statistics used different units of measurement. For example, comparing the counts of the number of commits and the time waiting for I/O, by units, does not directly make sense. However, it can be very useful to see how each varies relative to the other over time.
Chart Options
You can customize and manipulate a VSD chart in many ways to make your analysis easier. A few of the more useful are described here. The VSD application includes help for each menu item.
Selecting a Line
You can select an individual line from the Legend at the bottom, or by clicking on that line in the graph. Selecting a line colors it red and displays information about that line.
When a line is selected, the following information is available:
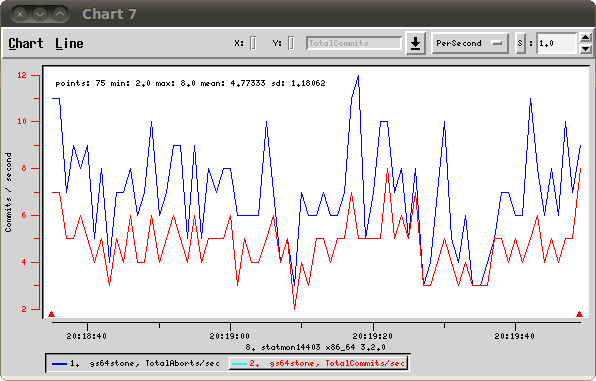
- On the graph itself, a brief summary statistics for the line. This includes the number of data points for that statistic, the minimum, maximum, and standard deviation are displayed. These units stay the same regardless of scale or transformation.
- When the mouse is over a data point in the graph, the X (time) and Y (units) of that point are displayed. These units stay the same regardless of scale or transformation.
- the name of the statistic.
- the current filter. The filter allows you to distinguish absolute values from rates of change. Each statistic has a default filter, which can be changed as needed.
- The scale or other transformation. The scale allows you to compare lines with widely different ranges of values, by scaling one or the other to bring the ranges closer together.
Changing Line Options
Filters
The filter allows you to view either absolute values, rates of change per second or sample. Filter options are:
None — Displays the values for the statistic exactly as they are expressed in the statmonitor text file.
PerSample — Displays the difference between two consecutive samples of the statistic.
PerSecond — Displays the difference between two consecutive samples of the statistic, divided by the number of elapsed seconds between the two samples.
Aggregate — Displays a running total for the per-sample deltas of the statistic.
Scaling
When you have multiple lines with widely different ranges of values, you can increase the visibility of a line relative to the other line by scaling it.
Select the line, and in the upper right, use the arrow indicators to scale up or down the line.
Other Transformations
By default, S is selected for the transformation setting, between the filter list and the scaling value entry field. When S is selected, the numeric scrolling field is used to scale the selected line.
You may also select other options, rather than S . This allows you to transform the line by adding, subtracting, multiplying, or dividing the value in the numeric scrolling field.
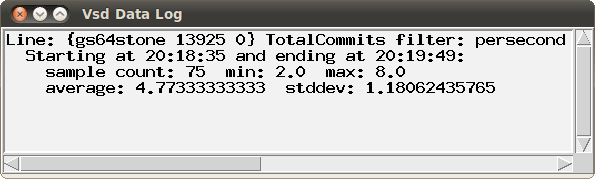
Summary of Information on a line
The menu item Line > Log Info will open (or append to an already open log window), summary information about a single line. For example:
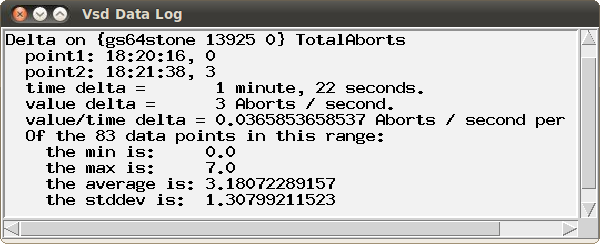
Summary of Information on a section of line
A very useful tool is collecting statistics on a section of line. For example, you may want to know the commit rate over a single period of intense activity, rather than for the entire period of sampling.
The menu item Line > Log Delta will allow you to select two point on the selected line. It then opens (or appends to an already open log window), summary information about that section of line.
Other ways to control the view
There are many ways to control what you are viewing to make analysis of your data easier. Here are a few that are particularly useful.
Combining statistics values for multiple processes
Normally, when opening a chart or adding lines to an existing chart, one line is added for each selected process for each selected statistic. If you have selected a large number of processes — for example, all Gems — this may be cumbersome to see in the resulting chart.
In cases like this, you can combine values for a single statistic for all the selected processes. To combine values, in the Main VSD Window, check the value Combine in the Main menu or in the right mouse button popup menu.
Graphing against scales on both right and left side Y-axis
By default, all lines in a graph are plotted according to Y-axis units scaled on the left-hand side of the chart. You can instead plot some of the lines according to units scaled on the right-hand side of the chart, which will allow them to use a different scale. This is useful when the lines use different units of measurement from those plotted on the left.
To change the side on which a line is selected, with the line selected in a Chart Window, uncheck the value Graph on left axis on the Line menu.
Process names in GemStone
When statmonitor records statistics for Gem processes, it records them with the name “Gem”, or for linked topaz logins, “Topaz”. This can be modified on the GemStone server after the gem logs in. This can be particularly useful for regular maintenance processes, such as your backup or markForCollection, that are run from scripts.
To do so, as soon possible after login, in the session you want to rename, execute:
System cacheName: 'myName '
Depending on how soon you can execute this after login and the statmonitor sample rate, you may have one or more samples showing the original default name.
Changing Hours Offset
Timestamps are recorded in statmonitor data files using GMT time. When these files are read into GemStone, VSd will translate these times into the current machine’s local time.
If you are viewing the data in VSD in the same time zone as the system that generated the statmonitor data, this means that VSD will display dates in the correct time, including adjusting for daylight savings time.
However, if you are viewing statistics in a different time zone, the timestamps will appear to be incorrect.
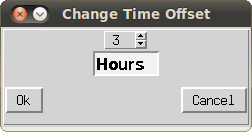
To correct this, use the main menu option Change Time Offset..., and select the number of hours plus or minus to adjust VSD’s display.
For example, if you are in U.S. Pacific Time and viewing statistics that were generated by a system running in U.S. Eastern Time, which is three hours ahead, add three hours:
2.4 Using and Creating Templates
VSD templates let you quickly create a chart with a commonly used set of statistics. Templates are helpful if you find yourself performing the same task frequently in VSD — for example, monitoring the same five or six statistics. By creating a template for the statistics that you want to monitor most frequently, you can automate the task of building charts.
VSD is shipped with a set of predefined templates. You can open charts on these templates using Template > New Template Chart , and choosing any of the predefined templates. If you create your own custom templates, they will also appear in this list.
You can create a custom template based on a chart you have created in VSD, or by editing the formatted text file that contains the templates. See VSD Chart Templates for more on the text file and how it is formatted, and editing this file outside of the GUI.
To create a custom template from VSD:
Step 1. set up a chart with the processes, statistics, scaling, and so on, that you want in your template.
Step 2. Chose the Chart menu item Save Template . This will prompt you to enter a name for the custom template. Hit the enter key when you are done.
You can now use your new template, from the Template > New Template Chart menu item.
if you want to remove your template, edit the .vsdtemplates file, and use the menu item Chart > Reload Template File to reload the templates file.
Gem and Pageserver Names in Templates
When you create a template that includes processes that are Gems or PageServers, the name of the process, as well as the type, is included in the template. This helps avoid an excessive number of lines appearing when the chart is opened.
The name that is included does not include any serial numbers that are displayed with the name in VSD. So for example, if the chart on which you are creating a template includes a Gem named Topaz19, the template will use Topaz* as the name. When you later use the template to create a chart, lines will be added for all Gems with the name Topaz.
Since you may have many Topaz processes, and cannot determine which one is performing a particular task such as backup or MFC, including Gem and Page server statistics in templates requires more consideration. Providing the Gem with a name, as described under Process names in GemStone, is one solution.
2. VSD’s Graphical Interface
Loading an existing statmonitor file
Updating the view if the data file is updated
Monitoring statistics on a running GemStone server
Controlling visibility of statistics
Hiding statistics with only values of zero
Selecting and viewing statistics
Summary of Information on a line
Summary of Information on a section of line
Other ways to control the view
Combining statistics values for multiple processes
Graphing against scales on both right and left side Y-axis